3
The history of AR and VR brings us to the present day’s hyper-active marketplace. The current market for AR and VR can be categorized into two major category divisions, Virtual Reality and Augmented Reality. As previously defined above, Virtual Reality, in current context, refers to completely immersive environment where the user’s visual experience is fully managed by the computer. Augmented Reality retains visual awareness of existing environs while overlaying or projecting computer generated content on the proximate scene.
Fully Immersive Virtual Reality systems represent the most mature set of marketed products. Vehicle Simulators and Cave Automated Virtual Environments (CAVE) systems have been in existence for several decades and find primary use in visualization and training. Military and law enforcement use such systems routinely along with architects, civil engineers and mechanical engineers.
Tethered headset implementations have also been evolving for many decades but with limited practical success until the introduction of Oculus Rift. Since the launch of Oculus in 2012, a rapid growth in binocular VR headsets has accelerated the market for consumer gaming and immersive video. This market is experiencing dramatic growth, according to IDC, 2.3 million AR and VR units were shipped worldwide in first quarter 2017, with VR units making up 98% of the volume. (Worldwide, 2017). IDC forecasts the market to grow to 99.4 million units in 2021, from 10.1 million in 2016. See Table 1.
| Top 5 Worldwide AR and VR Headset Companies, Shipments and Market Share, Q1 2017 (shipments in thousands) | ||
| Company | 1Q17 Shipments | 1Q17 Market Share |
| 1. Samsung | 489.5 | 21.5% |
| 2. Sony | 429.0 | 18.8% |
| 3. HTC | 190.9 | 8.4% |
| 4. Facebook | 99.3 | 4.4% |
| 5. TCL | 91.3 | 4.0% |
| Others | 980.0 | 43.0% |
| Total | 2280.0 | 100.0% |
| Source: IDC Worldwide AR/VR Headset Tracker, June 1, 2017 |
Table 1 Worldwide AR and VR Headset Companies, Shipments and Market Share, Q1 2017 (Sag, 2017)
Table Notes:
- The table represents shipments of Augmented Reality and Virtual Reality headsets only. Any additional software, services, or compute devices (e.g. PC, game console, smartphone, etc.) are excluded.
- Shipments of simplistic headsets that do not have any technology built in are excluded. Examples of such headsets include Google Cardboard and other Cardboard-like devices.
IDC Forecast Q4 2016 of AR / VR Headset Growth
Figure 2 Worldwide AR/VR Headset Forecast, 4Q 2016 (IDC, 2017)
Considering these recent sales figures and projected growth as shown in Figure 2, the 2016 Gartner hype cycle chart, (see Fig. 3) has correctly predicted the state of maturity for Virtual Reality and Augmented Reality. Will this year’s chart have them further onto the Plateau? It seems to be a safe conclusion judging from the sales data being reported in the first quarter of 2017 by IDC which shows total shipments reached 2.3 million units. (Worldwide Shipments, June 1, 2017)
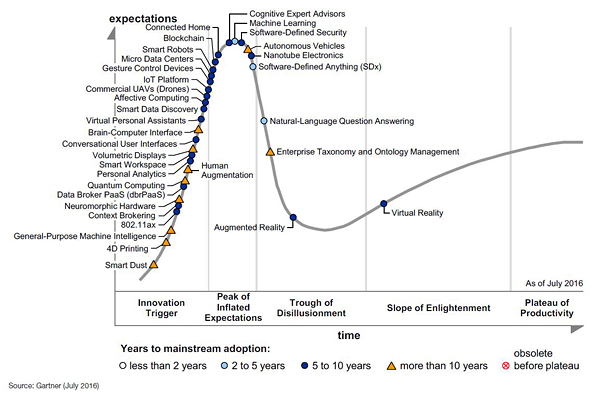
Figure 3 Gartner 2016 Hype Cycle Graph
